> ## Documentation Index
> Fetch the complete documentation index at: https://alphacastio.mintlify.site/llms.txt
> Use this file to discover all available pages before exploring further.
# Create AI View
> Build a chart, table or mini dashboard from the output of one or more earlier steps, generated and versioned by AI.
The **Create AI View** step builds a visualization — a chart, a table, or a small dashboard — from the output of steps earlier in the pipeline. Unlike the other output steps, it can draw on **several** prior steps at once.
## Configuration
 | Field | Description |
| ------------ | --------------------------------------------------------------------------------------------------- |
| Data sources | One or more earlier steps whose output feeds the view, added as **Data source 1**, **2** and so on. |
| Version | AI views are versioned and named — `v1 · EMBI Dashboard`. Pick which version this step renders. |
## Building a view
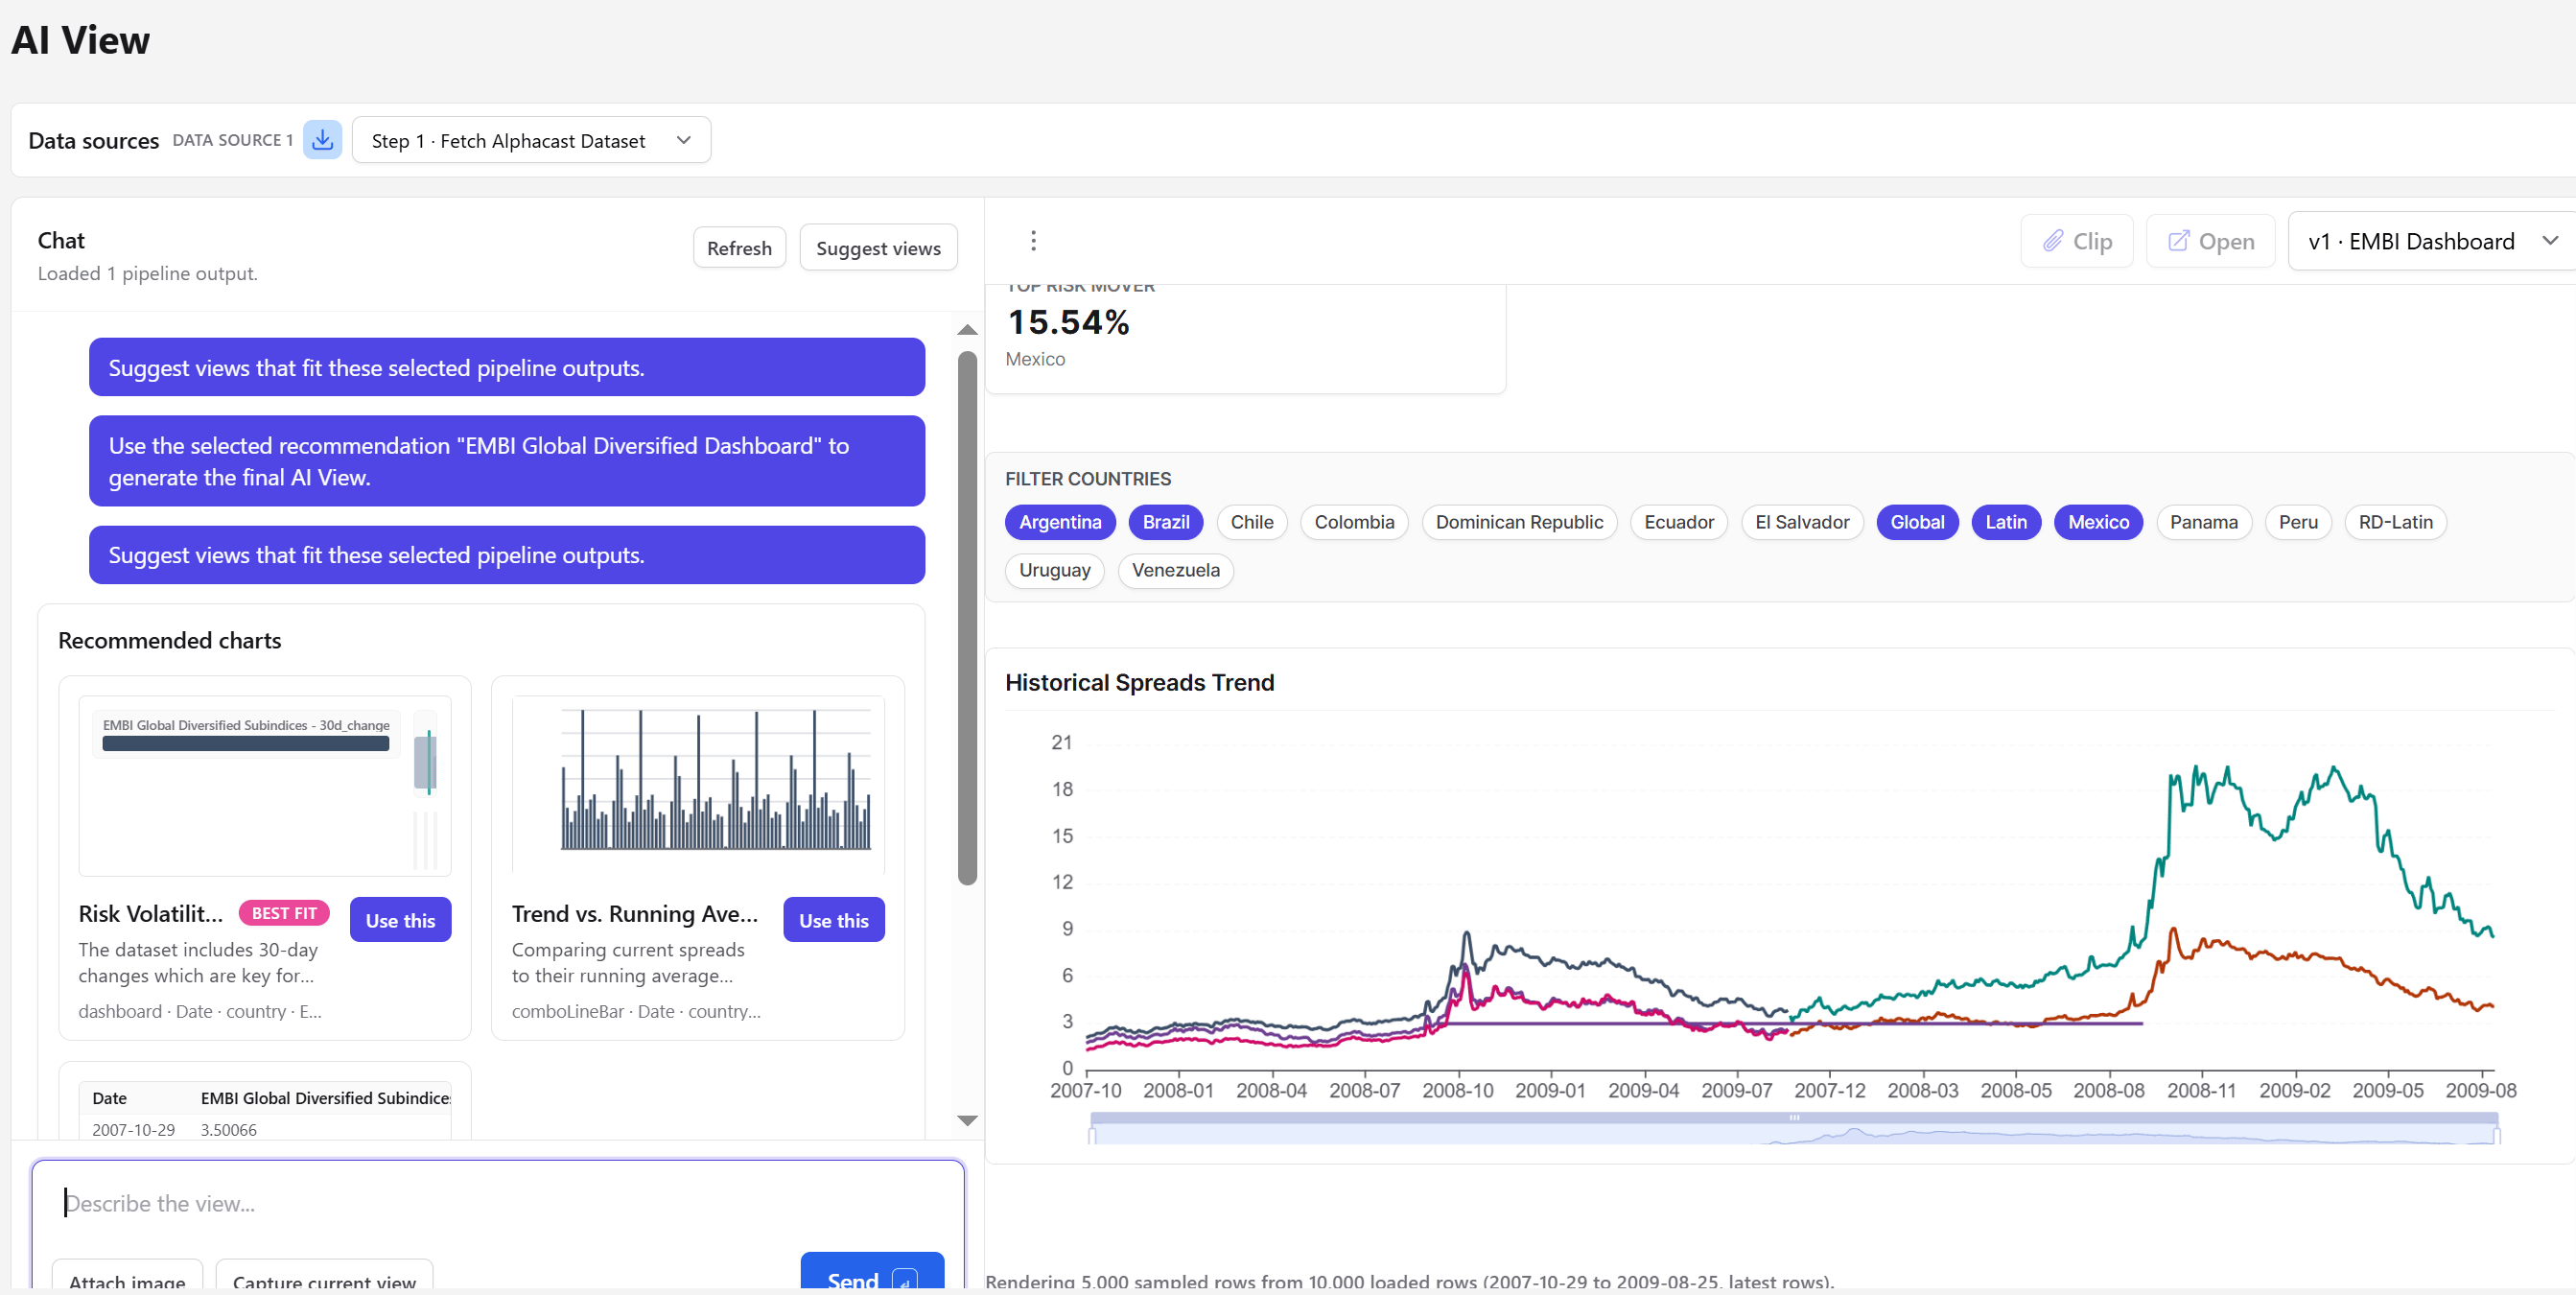
You can describe the view you want in the prompt, or press **Suggest views** and let Alphacast propose options based on the data it loaded. Suggestions arrive as **Recommended charts**, one flagged **BEST FIT**, each with a **Use this** button that generates the final view.
The prompt also accepts **Attach image** and **Capture current view**, so you can point at a reference design or iterate on what is already rendered.
## What it produces
Despite the name, the output is not limited to a single chart. A view can be a small dashboard combining stat tiles, filter chips and charts — the example above pairs a "top risk mover" tile with country filters and a historical spreads chart.
## Multiple inputs
This is what distinguishes the step from [Create a Chart](/steps/chart-data) and [Create a Table](/steps/table-view), which both work on the single stream of data reaching them. An AI View can combine, say, a monthly series from one branch and a summary table from another into one view — without merging them into a single dataset first.
Large inputs are sampled for rendering — the view reports how many rows it drew from how many loaded. Read the footer before concluding a chart shows the full history.
Every input must be a step whose output has actually been materialized. If you select a step that hasn't run, the view fails with a message naming the input — run the input step first, or pick a different one.
The step requires both a view and a selected version before it will run. Adding it without configuring it stops the pipeline rather than passing through silently, unlike most other steps.
## Next steps
Multiple views with shared filters, for dashboards.
A single chart from the current data.
| Field | Description |
| ------------ | --------------------------------------------------------------------------------------------------- |
| Data sources | One or more earlier steps whose output feeds the view, added as **Data source 1**, **2** and so on. |
| Version | AI views are versioned and named — `v1 · EMBI Dashboard`. Pick which version this step renders. |
## Building a view
You can describe the view you want in the prompt, or press **Suggest views** and let Alphacast propose options based on the data it loaded. Suggestions arrive as **Recommended charts**, one flagged **BEST FIT**, each with a **Use this** button that generates the final view.
The prompt also accepts **Attach image** and **Capture current view**, so you can point at a reference design or iterate on what is already rendered.
## What it produces
Despite the name, the output is not limited to a single chart. A view can be a small dashboard combining stat tiles, filter chips and charts — the example above pairs a "top risk mover" tile with country filters and a historical spreads chart.
## Multiple inputs
This is what distinguishes the step from [Create a Chart](/steps/chart-data) and [Create a Table](/steps/table-view), which both work on the single stream of data reaching them. An AI View can combine, say, a monthly series from one branch and a summary table from another into one view — without merging them into a single dataset first.
Large inputs are sampled for rendering — the view reports how many rows it drew from how many loaded. Read the footer before concluding a chart shows the full history.
Every input must be a step whose output has actually been materialized. If you select a step that hasn't run, the view fails with a message naming the input — run the input step first, or pick a different one.
The step requires both a view and a selected version before it will run. Adding it without configuring it stops the pipeline rather than passing through silently, unlike most other steps.
## Next steps
Multiple views with shared filters, for dashboards.
A single chart from the current data.