> ## Documentation Index
> Fetch the complete documentation index at: https://alphacastio.mintlify.site/llms.txt
> Use this file to discover all available pages before exploring further.
# Create a Chart
> Turn pipeline output into a chart and customize it without leaving the pipeline.
**Create a Chart** is one of the pipeline's output steps. It charts the data as it stands at that point and lets you customize the result.
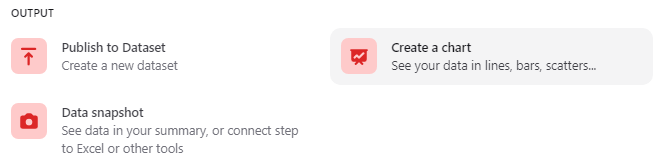 Select the **Create a chart** step and save. The pipeline then asks which variables to chart — either from the pipeline itself or from another dataset:
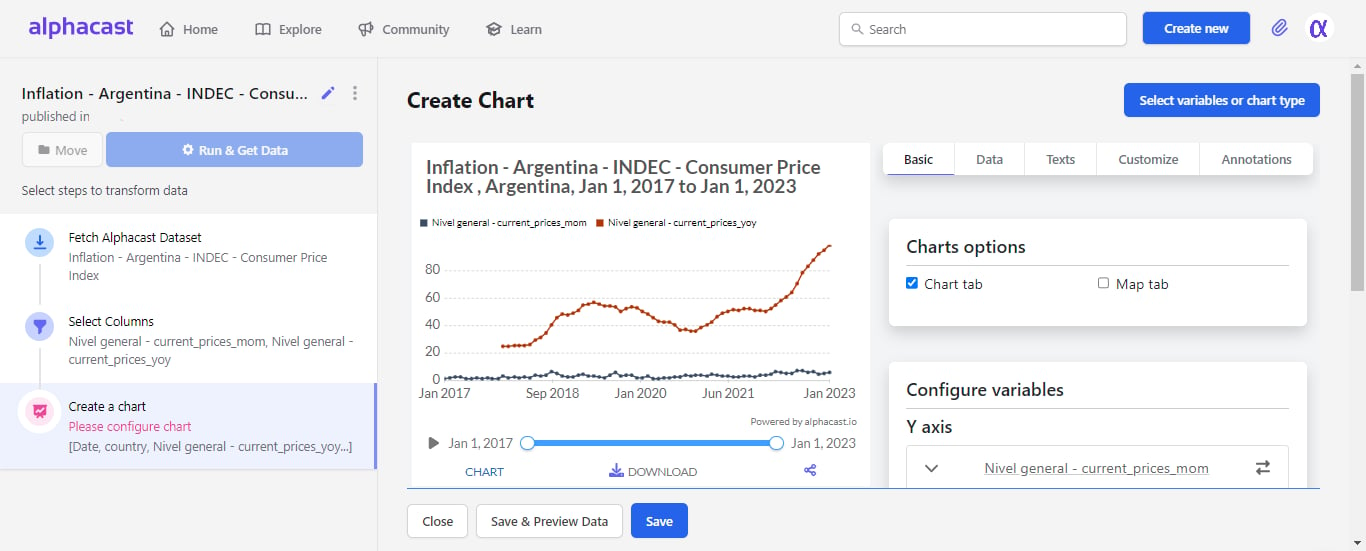
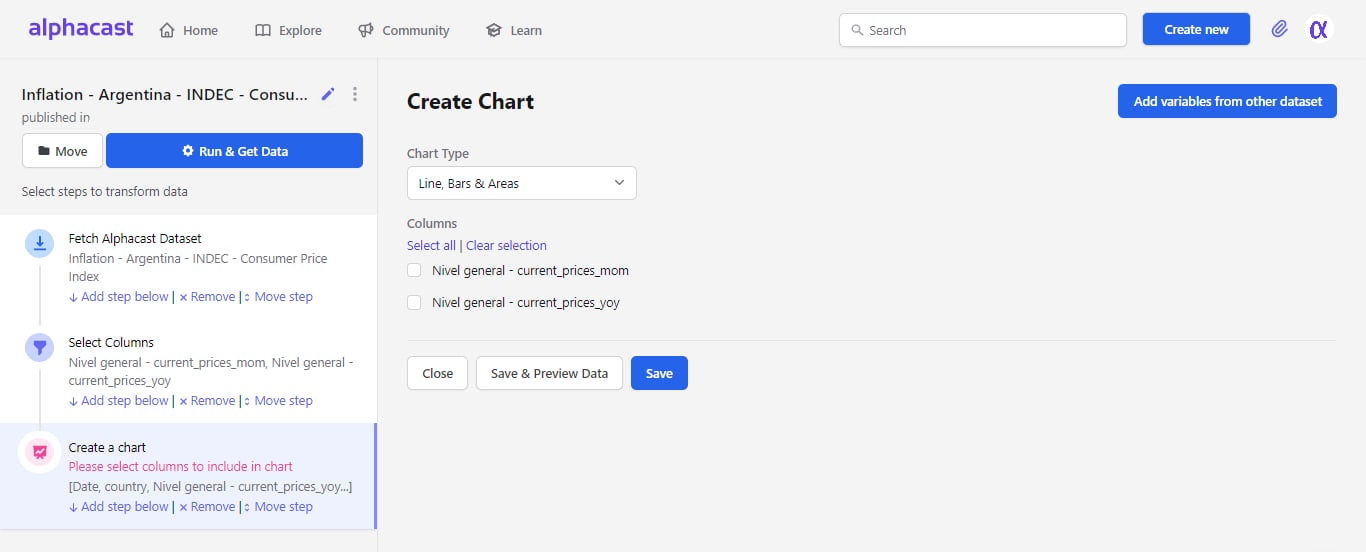 Once the variables are chosen, configure the chart:
 ## Customizing
Customization is split across five tabs — **Basic**, **Data**, **Texts**, **Customize** and **Annotations** — each covering a different set of options. [This video](https://www.youtube.com/watch?v=7IU_o6WGLmI\&t=1s) walks through them.
Chart configuration is also available to AI agents: the MCP server exposes the full chart config reference and a validator. See [Grapher tools](/mcp/tools/grapher).
## Next steps
Save the underlying data as an auto-updating dataset.
Produce a downloadable, embeddable snapshot.
## Customizing
Customization is split across five tabs — **Basic**, **Data**, **Texts**, **Customize** and **Annotations** — each covering a different set of options. [This video](https://www.youtube.com/watch?v=7IU_o6WGLmI\&t=1s) walks through them.
Chart configuration is also available to AI agents: the MCP server exposes the full chart config reference and a validator. See [Grapher tools](/mcp/tools/grapher).
## Next steps
Save the underlying data as an auto-updating dataset.
Produce a downloadable, embeddable snapshot.