> ## Documentation Index
> Fetch the complete documentation index at: https://alphacastio.mintlify.site/llms.txt
> Use this file to discover all available pages before exploring further.
# Portfolio Statistics and Tear Sheets
> Design and test portfolio and trading strategies — tear sheets from daily returns, plus dynamic rolling stats.
Alphacast pipelines can be used to design and test portfolio and trading strategies. The **Portfolio Analysis** step produces tear sheets from daily returns, and dynamic rolling statistics across timeframes.
 ## 1. Load data and calculate daily returns
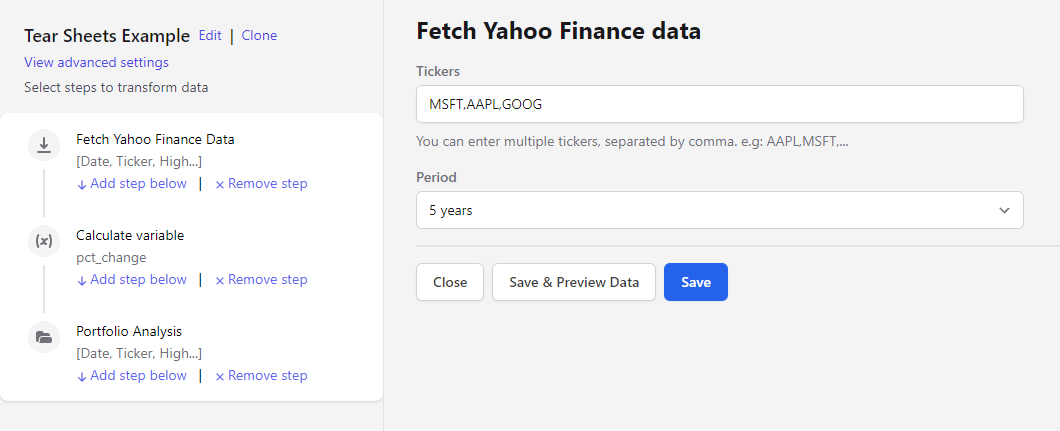
Any dataset works. As an example, load Yahoo Finance data and compute daily returns for three assets:
**Create new → Pipeline**.
Add the tickers you want to analyze — `MSFT`, `AAPL`, `GOOG` — and select the period.
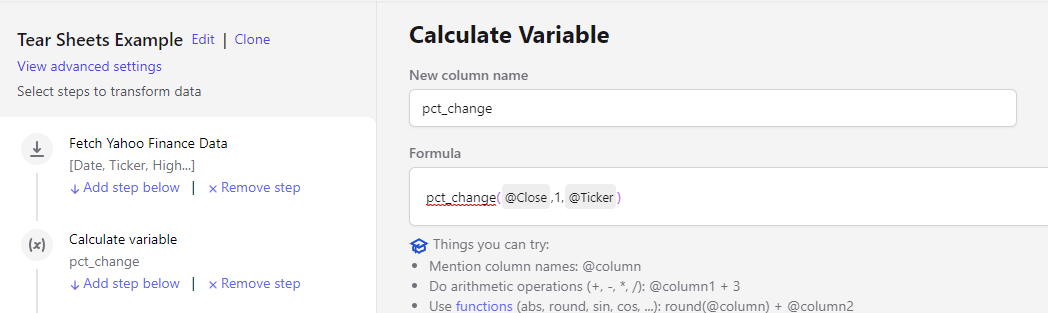
Add a [Calculate Variable](/steps/calculate-variable) step with the formula:
```
pct_change(@Close, 1, @Ticker)
```
## 1. Load data and calculate daily returns
Any dataset works. As an example, load Yahoo Finance data and compute daily returns for three assets:
**Create new → Pipeline**.
Add the tickers you want to analyze — `MSFT`, `AAPL`, `GOOG` — and select the period.
Add a [Calculate Variable](/steps/calculate-variable) step with the formula:
```
pct_change(@Close, 1, @Ticker)
```

 ## 2. Calculate the tear sheet
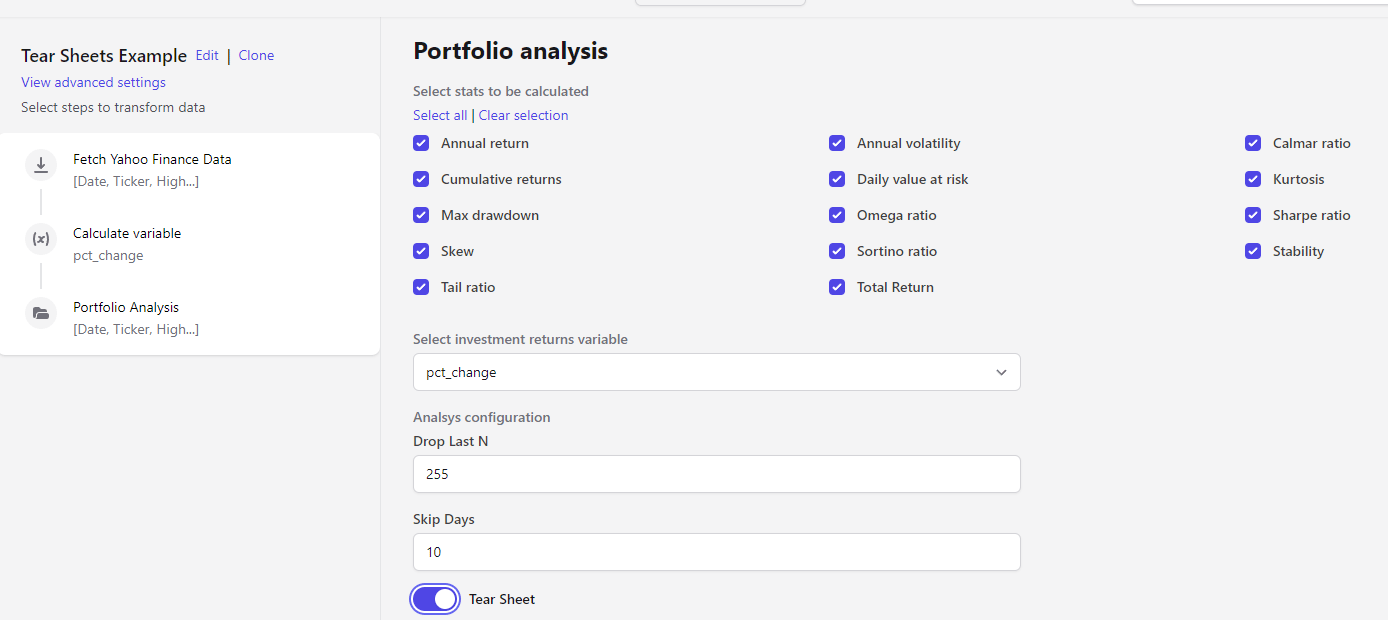
Add a **Portfolio Analysis** step, choose the metrics to compute, and select the column holding the daily returns — `pct_change` in this example.
Available statistics: annual return, cumulative returns, annual volatility, Sharpe ratio, Calmar ratio, stability, max drawdown, Omega ratio, Sortino ratio, skew, kurtosis, tail ratio, daily value at risk, and total return.
## 2. Calculate the tear sheet
Add a **Portfolio Analysis** step, choose the metrics to compute, and select the column holding the daily returns — `pct_change` in this example.
Available statistics: annual return, cumulative returns, annual volatility, Sharpe ratio, Calmar ratio, stability, max drawdown, Omega ratio, Sortino ratio, skew, kurtosis, tail ratio, daily value at risk, and total return.
 ### Tear sheet on
A single tear sheet is calculated for the whole sample period.
### Tear sheet on
A single tear sheet is calculated for the whole sample period.
 ### Tear sheet off
Statistics are estimated recursively for each day of the sample, each one computed from that day up to the most recent one. Two extra parameters apply:
| Parameter | Meaning |
| ----------- | ------------------------------------------------------------------------------------------------------------------ |
| `dropLastN` | Statistics are not calculated for timeframes beginning in the last N days. Defaults to excluding 252 trading days. |
| `Skip days` | Start days are sampled every N days rather than daily. Matters for performance. Defaults to 10 days. |
The result looks like [this dataset](https://www.alphacast.io/datasets/23156).
## Optional: add technical indicators
The [Technical Analysis](/steps/talib) step estimates 132 metrics on the same price data — cycle, momentum, volatility and volume indicators, overlap studies, pattern recognition and statistics functions.
## Next steps
132 technical indicators for the same assets.
Save the tear sheet as an auto-updating dataset.
### Tear sheet off
Statistics are estimated recursively for each day of the sample, each one computed from that day up to the most recent one. Two extra parameters apply:
| Parameter | Meaning |
| ----------- | ------------------------------------------------------------------------------------------------------------------ |
| `dropLastN` | Statistics are not calculated for timeframes beginning in the last N days. Defaults to excluding 252 trading days. |
| `Skip days` | Start days are sampled every N days rather than daily. Matters for performance. Defaults to 10 days. |
The result looks like [this dataset](https://www.alphacast.io/datasets/23156).
## Optional: add technical indicators
The [Technical Analysis](/steps/talib) step estimates 132 metrics on the same price data — cycle, momentum, volatility and volume indicators, overlap studies, pattern recognition and statistics functions.
## Next steps
132 technical indicators for the same assets.
Save the tear sheet as an auto-updating dataset.