> ## Documentation Index
> Fetch the complete documentation index at: https://alphacastio.mintlify.site/llms.txt
> Use this file to discover all available pages before exploring further.
# Change Frequency
> Resample a dataset to a different time frequency, interpolating up or aggregating down.
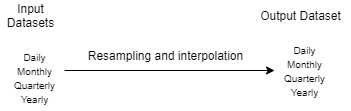
Every dataset has a frequency — daily, weekly, monthly, quarterly or yearly. The **Change Frequency** step converts between them and recalculates the values accordingly.
Moving from a higher to a lower frequency requires an **aggregation** formula, such as average or end of period. Moving from a lower to a higher frequency requires an **interpolation** formula, such as linear interpolation or splines.
 ## How to resample
The system detects the input frequency automatically.
## How to resample
The system detects the input frequency automatically.
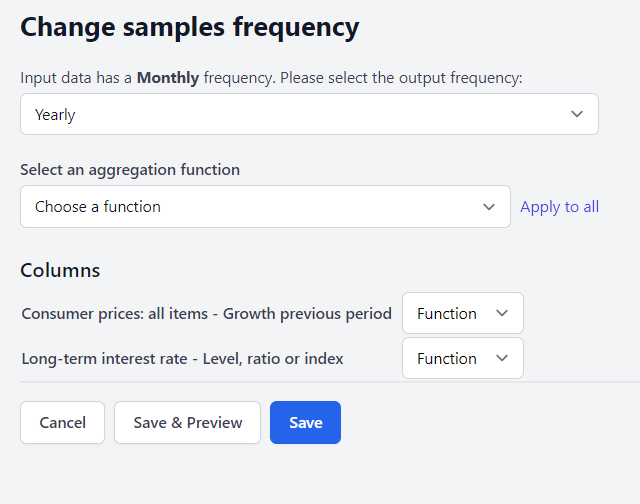 This determines whether the step interpolates or downscales.
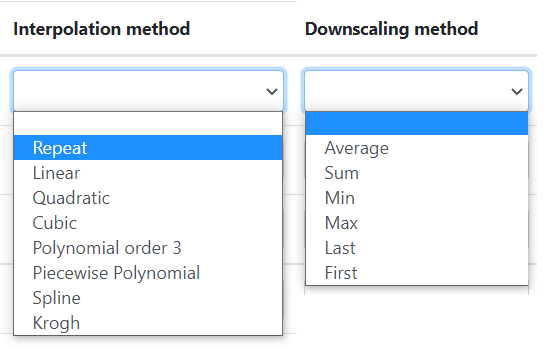
**Going up in frequency** (monthly to daily) offers 9 interpolation options: Repeat, Linear, Quadratic, Cubic, Polynomial order 3, Piecewise Polynomial, Spline, Krogh, and Fill with 0.
**Going down in frequency** (monthly to quarterly) offers 6 aggregations: Average, Sum, Min, Max, Last and First.
This determines whether the step interpolates or downscales.
**Going up in frequency** (monthly to daily) offers 9 interpolation options: Repeat, Linear, Quadratic, Cubic, Polynomial order 3, Piecewise Polynomial, Spline, Krogh, and Fill with 0.
**Going down in frequency** (monthly to quarterly) offers 6 aggregations: Average, Sum, Min, Max, Last and First.
 Interpolating to a higher frequency invents data points that were never observed. It is appropriate for aligning series before a join, but the interpolated values should not be treated as measurements.
## Next steps
Join series once they share a frequency.
Frequency-aware transformations like year-over-year change.
Interpolating to a higher frequency invents data points that were never observed. It is appropriate for aligning series before a join, but the interpolated values should not be treated as measurements.
## Next steps
Join series once they share a frequency.
Frequency-aware transformations like year-over-year change.