> ## Documentation Index
> Fetch the complete documentation index at: https://alphacastio.mintlify.site/llms.txt
> Use this file to discover all available pages before exploring further.
# Technical Analysis
> Estimate 132 technical analysis metrics on financial assets — momentum, volatility, volume, overlap studies and pattern recognition.
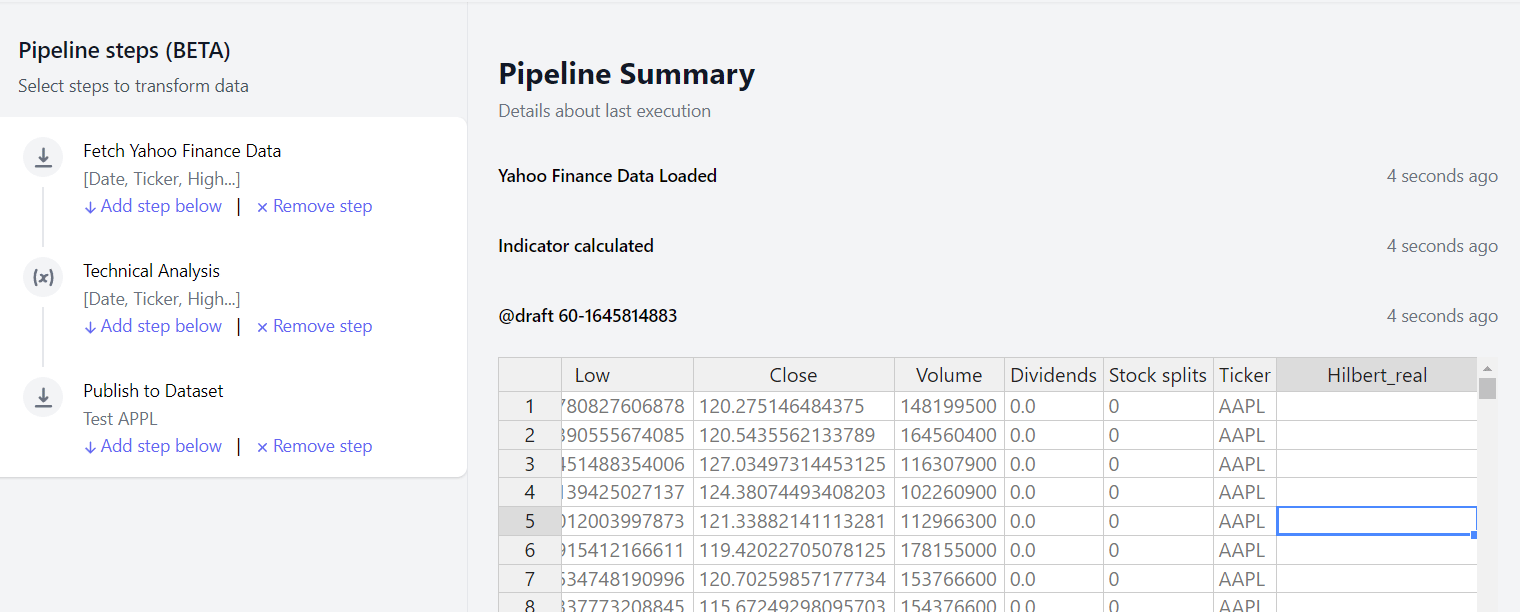
The **Technical Analysis** step estimates 132 metrics for the technical analysis of financial assets, drawn from TA-Lib and grouped into eight families.
## How to use it
Most metrics need open, close, high, low and volume variables to work properly. You can load these directly with [Fetch Yahoo Finance](/steps/fetch-yahoo).
Select the function group, the function, its parameters and an optional prefix, then press save. The new variables are added to the dataset.
 ## Function groups
Pick a group first, then a function within it. Each function exposes its own parameters, prefilled with TA-Lib defaults.
| Group | Functions | Examples |
| --------------------- | --------- | --------------------------------------------------------------- |
| Pattern Recognition | 61 | `CDLDOJI`, `CDLENGULFING`, `CDLABANDONEDBABY`, `CDL3BLACKCROWS` |
| Momentum Indicators | 30 | `RSI`, `MACD`, `ADX`, `AROON`, `APO` |
| Overlap Studies | 17 | `SMA`, `EMA`, `BBANDS`, `SAR`, `KAMA` |
| Statistic Functions | 9 | `BETA`, `CORREL`, `LINEARREG`, `STDDEV` |
| Cycle Indicators | 5 | `HT_DCPERIOD`, `HT_DCPHASE`, `HT_SINE`, `HT_TRENDMODE` |
| Price Transform | 4 | `AVGPRICE`, `MEDPRICE`, `TYPPRICE`, `WCLPRICE` |
| Volatility Indicators | 3 | `ATR`, `NATR`, `TRANGE` |
| Volume Indicators | 3 | `AD`, `ADOSC`, `OBV` |
Each function's output columns are named after the indicator and prefixed with whatever you enter in the **prefix** field, so you can run the same indicator more than once with different parameters.
The complete function list, with a plain-language description and default parameters for each, is in the group and function dropdowns of the step itself.
[This example dataset](https://www.alphacast.io/datasets/18042) contains every metric estimated for AAPL.
## Next steps
Build tear sheets and rolling performance stats.
Load the price data these metrics need.
## Function groups
Pick a group first, then a function within it. Each function exposes its own parameters, prefilled with TA-Lib defaults.
| Group | Functions | Examples |
| --------------------- | --------- | --------------------------------------------------------------- |
| Pattern Recognition | 61 | `CDLDOJI`, `CDLENGULFING`, `CDLABANDONEDBABY`, `CDL3BLACKCROWS` |
| Momentum Indicators | 30 | `RSI`, `MACD`, `ADX`, `AROON`, `APO` |
| Overlap Studies | 17 | `SMA`, `EMA`, `BBANDS`, `SAR`, `KAMA` |
| Statistic Functions | 9 | `BETA`, `CORREL`, `LINEARREG`, `STDDEV` |
| Cycle Indicators | 5 | `HT_DCPERIOD`, `HT_DCPHASE`, `HT_SINE`, `HT_TRENDMODE` |
| Price Transform | 4 | `AVGPRICE`, `MEDPRICE`, `TYPPRICE`, `WCLPRICE` |
| Volatility Indicators | 3 | `ATR`, `NATR`, `TRANGE` |
| Volume Indicators | 3 | `AD`, `ADOSC`, `OBV` |
Each function's output columns are named after the indicator and prefixed with whatever you enter in the **prefix** field, so you can run the same indicator more than once with different parameters.
The complete function list, with a plain-language description and default parameters for each, is in the group and function dropdowns of the step itself.
[This example dataset](https://www.alphacast.io/datasets/18042) contains every metric estimated for AAPL.
## Next steps
Build tear sheets and rolling performance stats.
Load the price data these metrics need.