Customizing
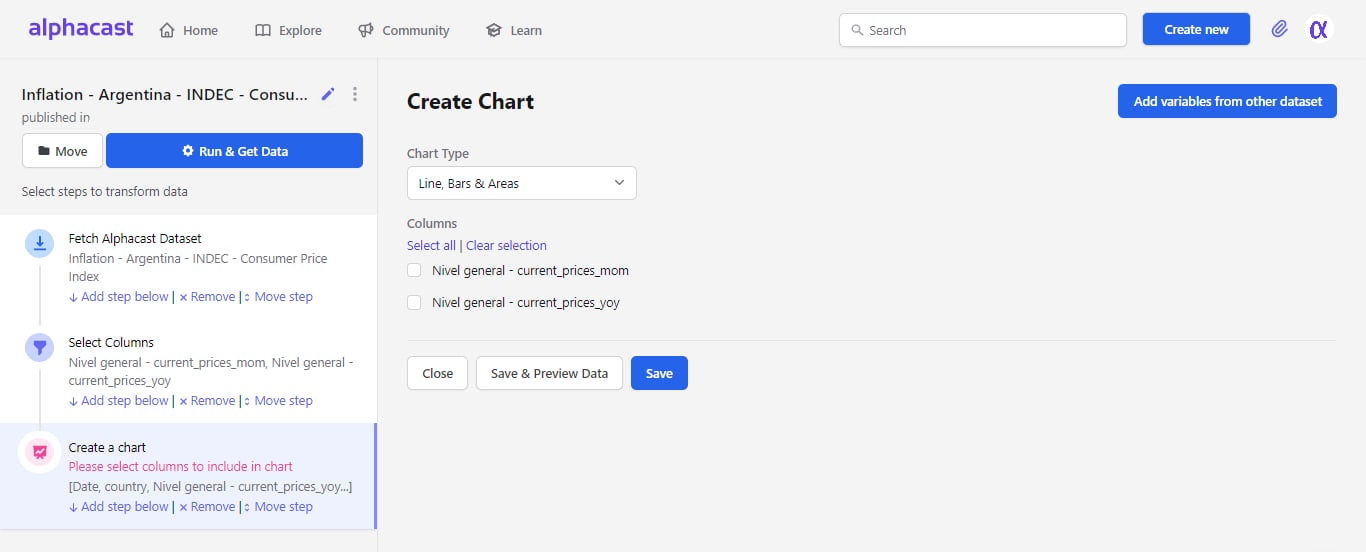
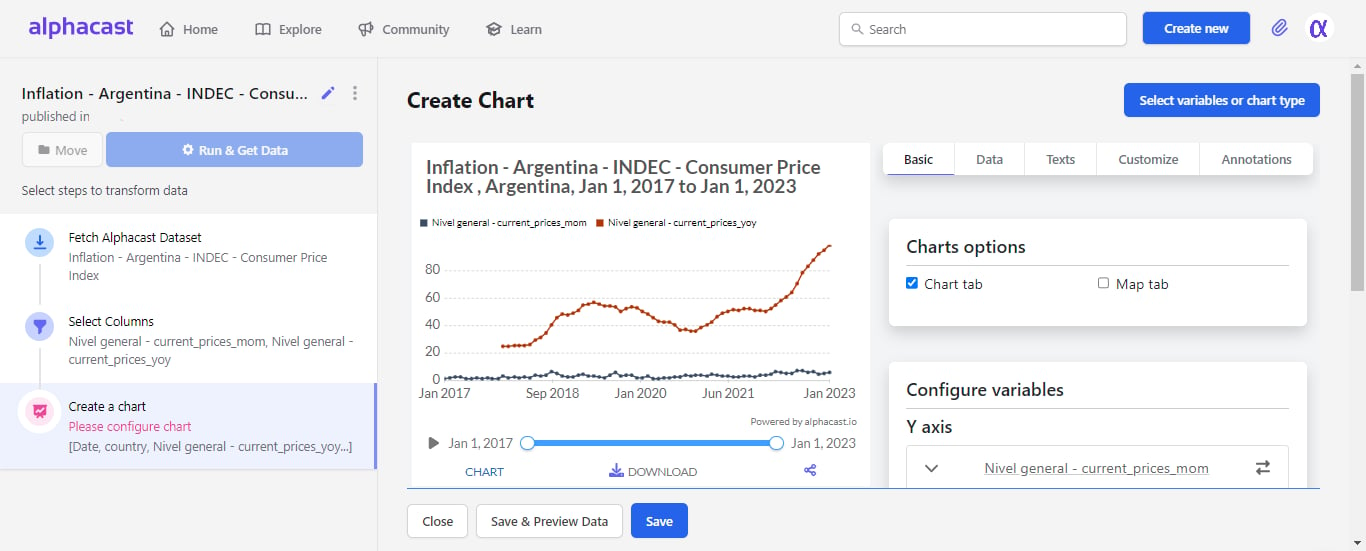
Customization is split across five tabs — Basic, Data, Texts, Customize and Annotations — each covering a different set of options. This video walks through them.Chart configuration is also available to AI agents: the MCP server exposes the full chart config reference and a validator. See Grapher tools.
Next steps
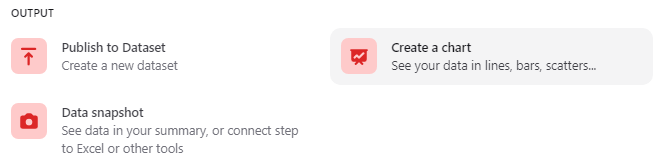
Publish dataset
Save the underlying data as an auto-updating dataset.
Data snapshot
Produce a downloadable, embeddable snapshot.