Configuration
Building a view
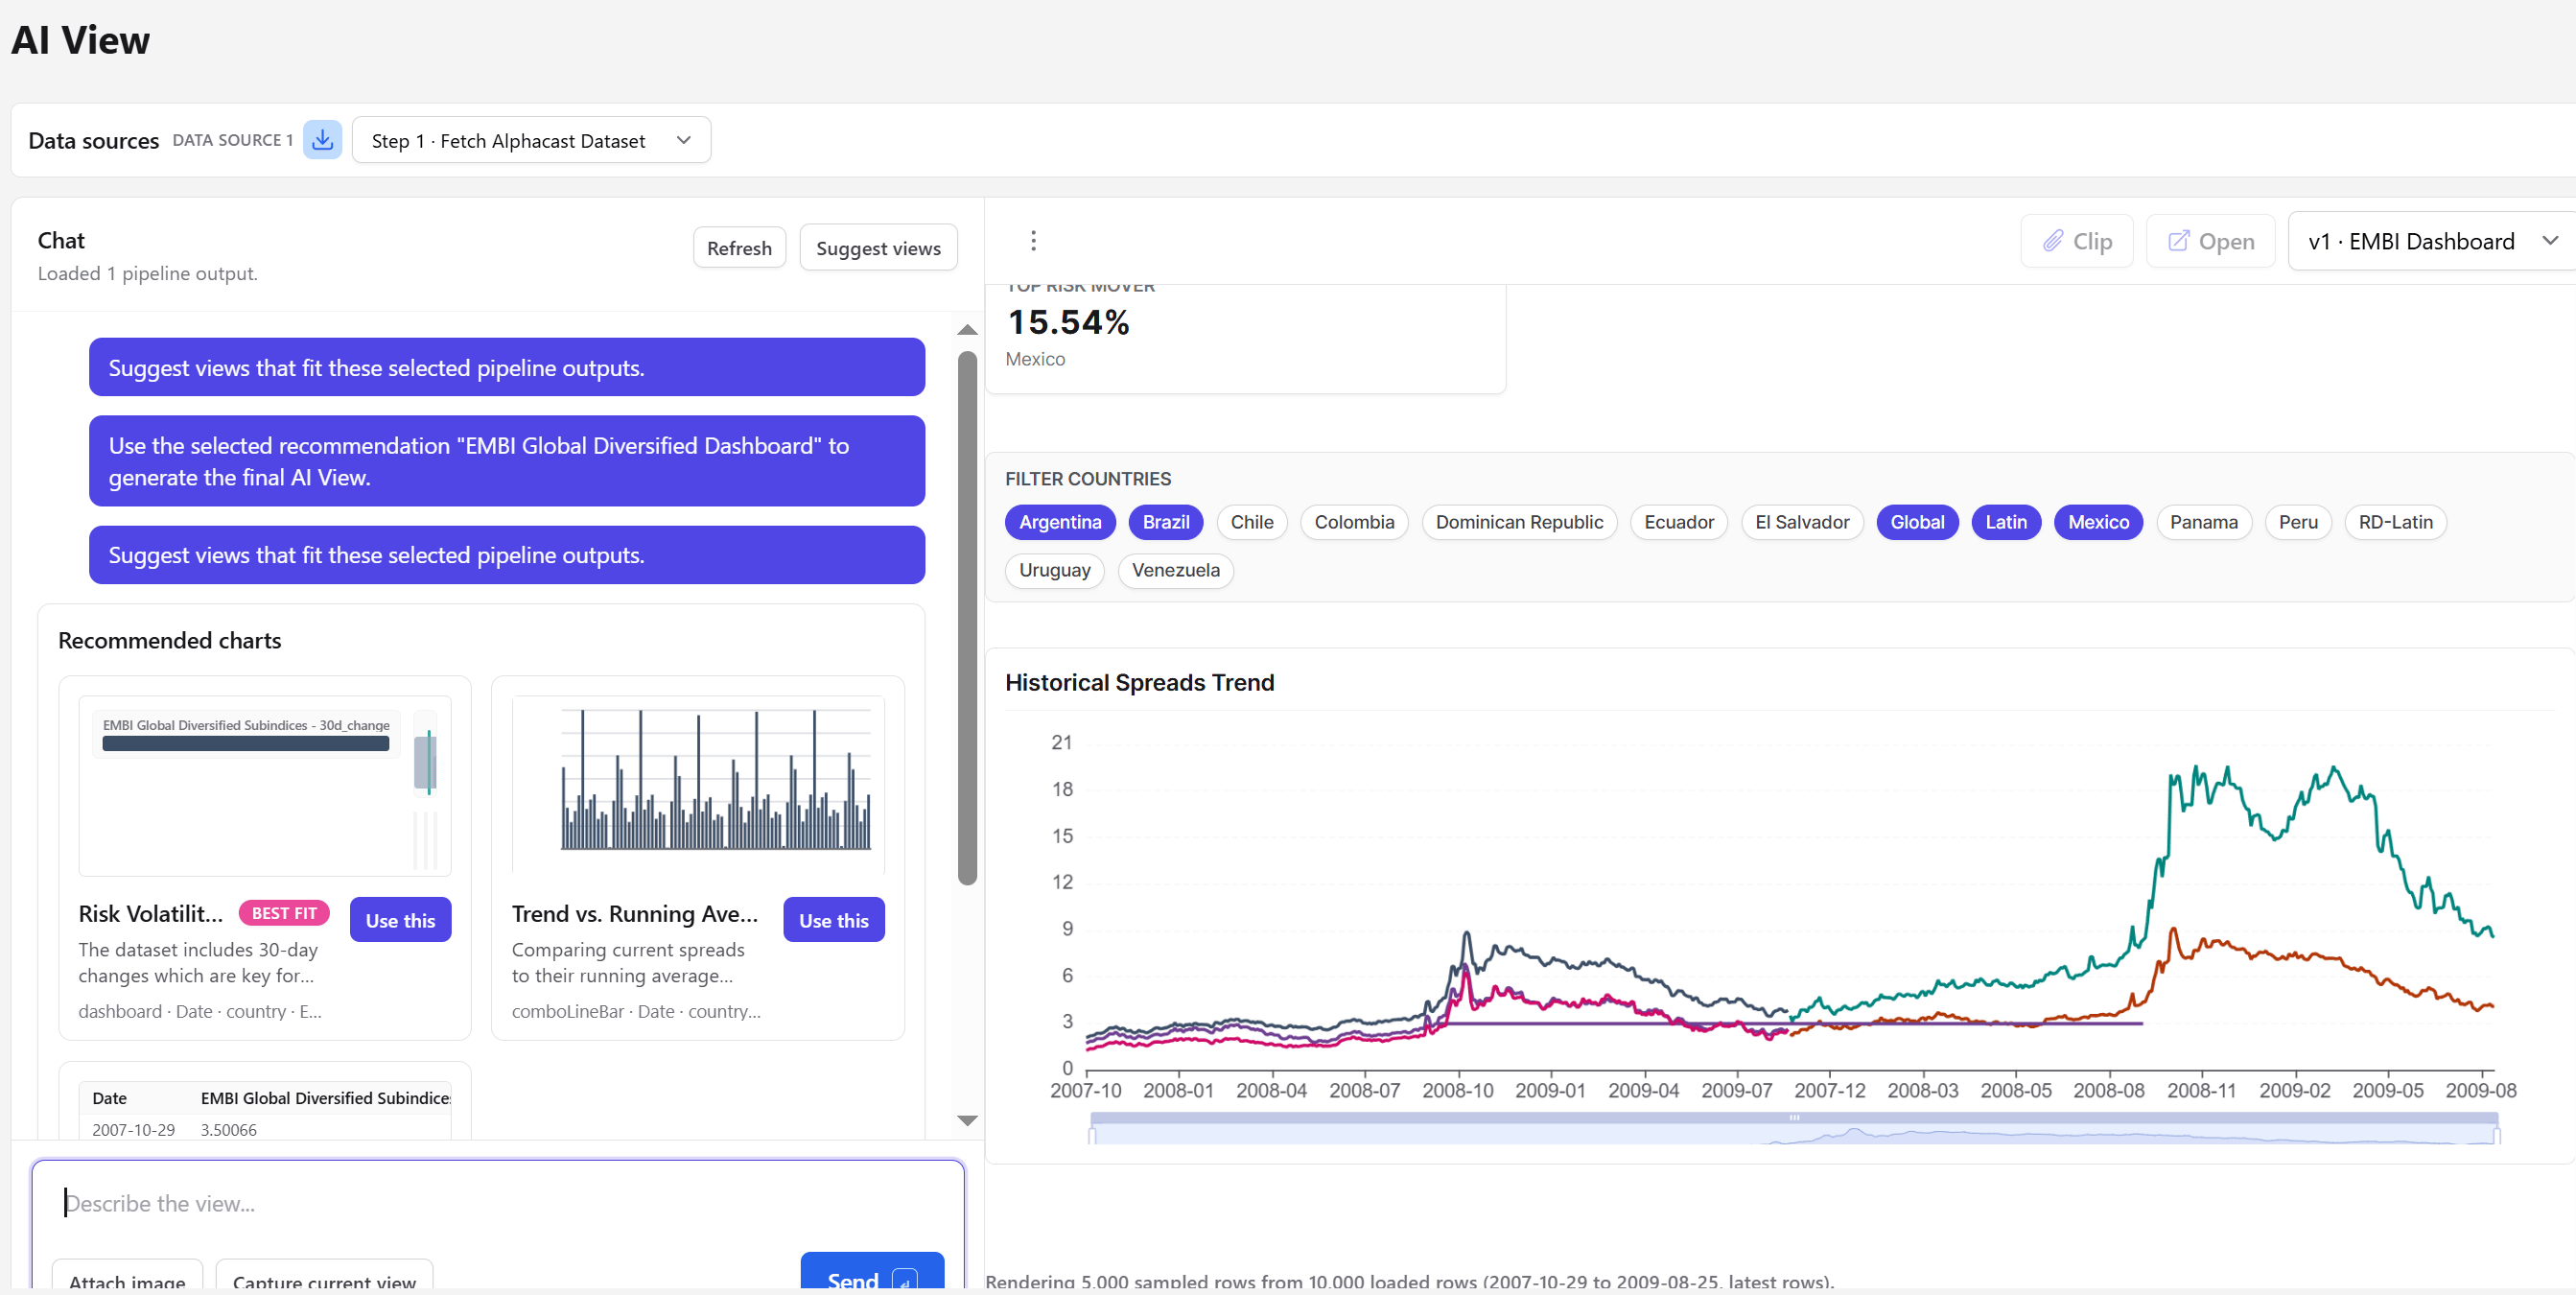
You can describe the view you want in the prompt, or press Suggest views and let Alphacast propose options based on the data it loaded. Suggestions arrive as Recommended charts, one flagged BEST FIT, each with a Use this button that generates the final view. The prompt also accepts Attach image and Capture current view, so you can point at a reference design or iterate on what is already rendered.What it produces
Despite the name, the output is not limited to a single chart. A view can be a small dashboard combining stat tiles, filter chips and charts — the example above pairs a “top risk mover” tile with country filters and a historical spreads chart.Multiple inputs
This is what distinguishes the step from Create a Chart and Create a Table, which both work on the single stream of data reaching them. An AI View can combine, say, a monthly series from one branch and a summary table from another into one view — without merging them into a single dataset first.Large inputs are sampled for rendering — the view reports how many rows it drew from how many loaded. Read the footer before concluding a chart shows the full history.
The step requires both a view and a selected version before it will run. Adding it without configuring it stops the pipeline rather than passing through silently, unlike most other steps.
Next steps
Create a Deck of views
Multiple views with shared filters, for dashboards.
Create a Chart
A single chart from the current data.