
1. Load data and calculate daily returns
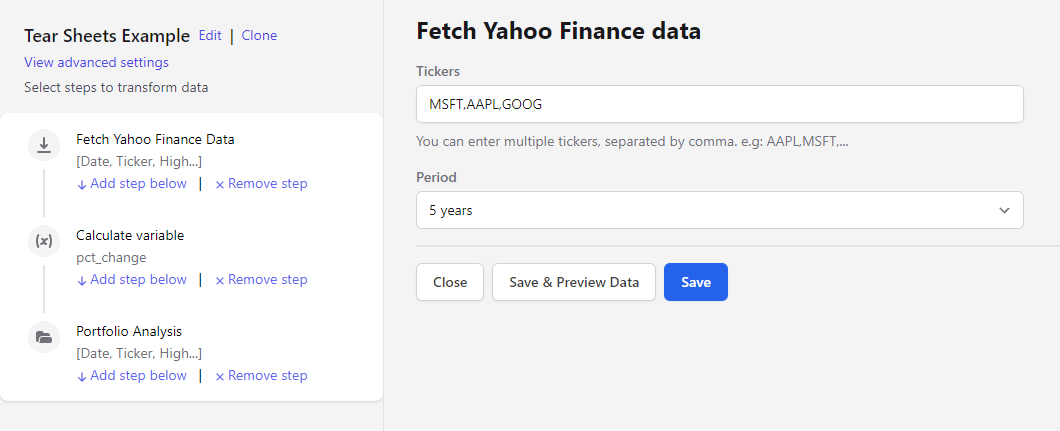
Any dataset works. As an example, load Yahoo Finance data and compute daily returns for three assets:1
Open the pipeline editor
Create new → Pipeline.
2
Add Yahoo Finance as the source
Add the tickers you want to analyze —
MSFT, AAPL, GOOG — and select the period.3
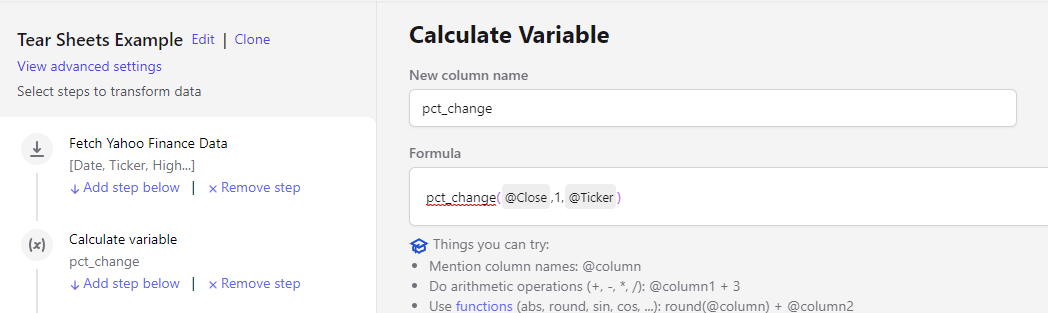
Calculate the daily return

2. Calculate the tear sheet
Add a Portfolio Analysis step, choose the metrics to compute, and select the column holding the daily returns —pct_change in this example.
Available statistics: annual return, cumulative returns, annual volatility, Sharpe ratio, Calmar ratio, stability, max drawdown, Omega ratio, Sortino ratio, skew, kurtosis, tail ratio, daily value at risk, and total return.
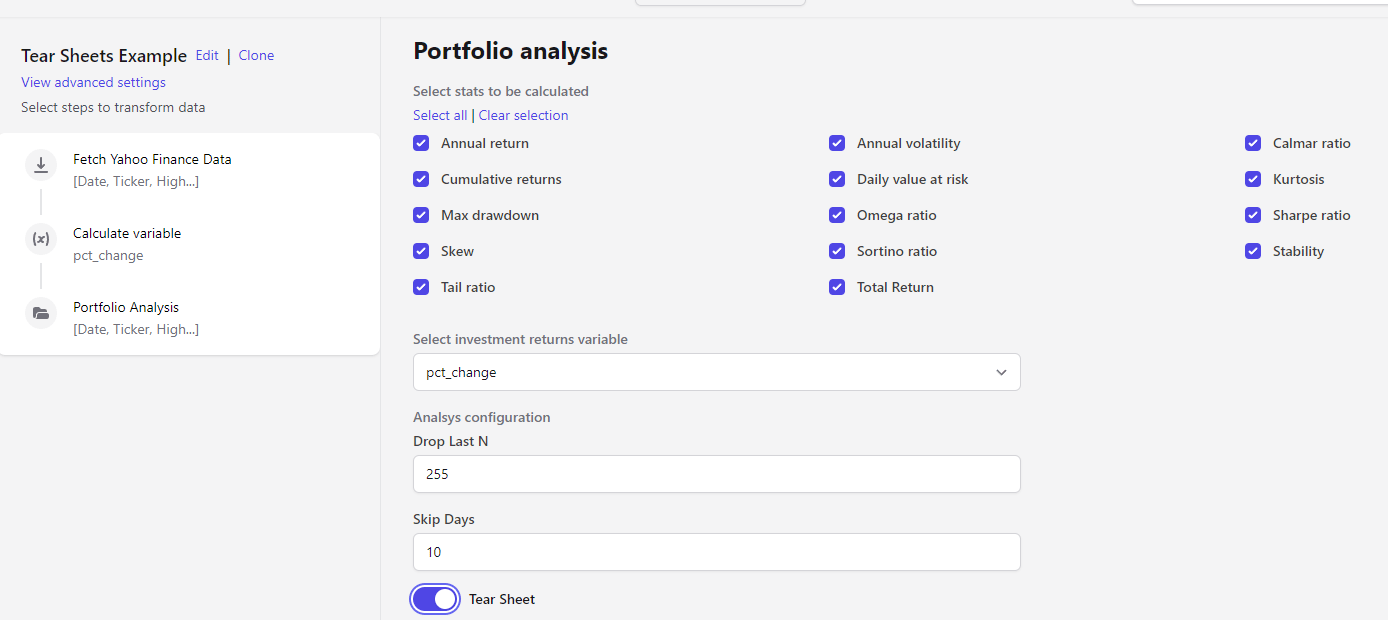
Tear sheet on
A single tear sheet is calculated for the whole sample period.
Tear sheet off
Statistics are estimated recursively for each day of the sample, each one computed from that day up to the most recent one. Two extra parameters apply:
The result looks like this dataset.
Optional: add technical indicators
The Technical Analysis step estimates 132 metrics on the same price data — cycle, momentum, volatility and volume indicators, overlap studies, pattern recognition and statistics functions.Next steps
Technical analysis
132 technical indicators for the same assets.
Publish dataset
Save the tear sheet as an auto-updating dataset.